Sylvia Parrish, Chief Business Columnist
July 01, 2026 · 12 min read
I compared serverless cold start times for API routing
There's a number every serverless architect should be able to recite from memory: 1.8 seconds. That's roughly how long a cold-starting Java Lambda takes to answer its first request in production.
A clean number, before any architecture-speak. Serverless cold start latency lives in a brutal range: roughly 100 milliseconds for a lean Go or Node.js function with a small deployment artifact, all the way to 2 seconds for a heavy Java/JVM bundle pulling in 80MB of dependencies. The variance is structural, not statistical, and it tracks every variable decision you made about runtime, memory, and code footprint. Knowing where that variance comes from is what separates teams who ship reliable APIs from those who blame "the network" every time a tail latency spikes.
The Mechanics of Cold Start Latency in API Gateways
Before we chase benchmarks, let's decompose what actually happens inside that pause. When a request lands at an API Gateway or Application Load Balancer and routes to a Lambda — or its equivalent on Azure Functions or GCP Cloud Run — the provider checks its pool of warm execution environments. If none exist, the cold path begins.
Step one: container instantiation. The provider allocates a microVM or sandboxed container with the memory you configured. Step two: artifact download. Your deployment package — code, dependencies, layers — gets fetched from internal storage. A 50MB Node bundle with `node_modules` will arrive faster than a 200MB Java fat jar carrying Spring, Kafka clients, and a stack of observability SDKs. Step three: runtime boot. The language runtime starts, the JIT warms up, your initialization code runs — DB connection pools, SDK clients, cached config — and only then does the handler actually fire.
There is a step four that most documentation glosses over: the first-request penalty. Some runtimes — Java and.NET in particular — perform lazy initialization on the first real request after boot. The handler technically responds, but the first invocation pays for additional JIT compilation, class loading, and framework-level initialization that doesn't appear in the "cold start" metric most vendors publish. The number you see in their marketing slide is not the number your user feels.
Cold start is not a bug. It is the price of paying for compute you didn't provision, measured in milliseconds the user can feel.
Most teams measure the wrong slice. They measure handler duration post-init, which excludes the cold path entirely. Or they measure end-to-end API latency and blame the network. The actual cold start duration requires distributed tracing that wraps the request before it reaches the function and attributes the elapsed time to initialization phases. That distinction — visible time versus felt time — is where a great deal of architectural friction hides, and where a great deal of architectural hubris goes unpriced.
Runtime Selection: Why Go and Node.js Outperform Java
The single highest-leverage decision you can make is your runtime. I have watched CTOs spend six months on architecture diagrams, then choose Java because "the team already knows it," and quietly accept a 1.5-second cold start as the cost of doing business. The hubris is staggering, because the data is unforgiving.
Here is the comparative picture from production traces I have reviewed, cross-referenced against public benchmarks from Lumigo and the AWS Compute Blog:
| Parameter | Go | Node.js | Java/JVM | .NET |
|---|---|---|---|---|
| Typical cold start (128MB, small artifact) | 80–150ms | 120–250ms | 800–1500ms | 600–1200ms |
| Cold start at 512MB, optimized code | 50–100ms | 80–180ms | 500–1000ms | 450–900ms |
| Artifact size sensitivity | Low | Medium | High | High |
| Idle memory footprint | 20–40MB | 40–80MB | 150–300MB | 120–250MB |
The pattern is not subtle, and it scales predictably. Go compiles to a single static binary with no runtime to bootstrap. Node.js has a fast V8 startup and short require chains. Java, by contrast, drags in the JVM, classloaders, JIT compilation, and typically a heavyweight framework like Spring Boot that performs annotation scanning and bean wiring on every cold path. The same applies to.NET with its assembly loading and dependency injection. If your API is latency-sensitive and you retain any choice over runtime, the table above is the conversation you should be having on Monday morning, not buried in a backlog ticket three quarters from now.
There is a nuance worth stating explicitly: within the Java ecosystem, not all frameworks are equal. A raw Java function using the plain AWS SDK handler with no framework can cold-start in 400–600ms at 512MB. Add Spring Boot and you double or triple that. Add a service mesh sidecar and an agent-based APM tool bundled into the deployment artifact and you are now paying for someone else's architectural choices with your users' time. The framework tax is real, and it compounds at every layer.
The Correlation Between Memory Allocation and Initialization Speed
Here is a non-obvious lever that finance-side readers will appreciate: in AWS Lambda, and similarly in Azure Functions Premium, CPU power scales proportionally with memory allocation. Double the memory, you roughly double the CPU available for initialization. The runtime boots faster, dependencies extract faster, JIT compilation completes sooner.
This means a Java function at 1024MB cold-starts faster than the same function at 512MB — often by 30–40% — and at 3008MB, faster still. The memory cost is real; the latency dividend is quantifiable. I have seen teams map this curve and find that moving from 512MB to 1024MB shaved roughly 400ms off a Spring Boot cold start for under fifteen dollars a month of additional spend. That is the kind of trade a CFO can sign off on in five minutes, which is precisely why it remains the most underused lever in serverless operations.
The corollary, and the one I see violated constantly: if you are running Java or.NET and refuse to tune memory above the default 512MB, you are paying for the worst version of the cold start. Memory tuning is the cheapest architectural lever available, and most ops dashboards I audit show functions pinned to the lowest viable tier while the team remains in blissful denial about the cumulative latency tax they are quietly charging users.
One pattern I encourage teams to adopt is what I call the cold start budget chart. Plot cold start latency (Y-axis) against memory allocation (X-axis) for each of your top-ten most-invoked functions. The curve will flatten at some point — for Go it flattens almost immediately, for Java it keeps dropping past 2048MB. That inflection point is your rational memory allocation. Paying for memory beyond the knee of the curve buys you almost nothing; paying below it costs you real latency for trivial savings. Most teams have never drawn this curve. The ones who have almost always reallocate memory upward, because the latency savings dwarf the cost increase.
Tooling for Precision: Distributed Tracing and Synthetic Monitoring
If you cannot measure cold start latency cleanly, every other decision is decoration. Let me walk through the stack that delivers actionable numbers rather than vanity averages.
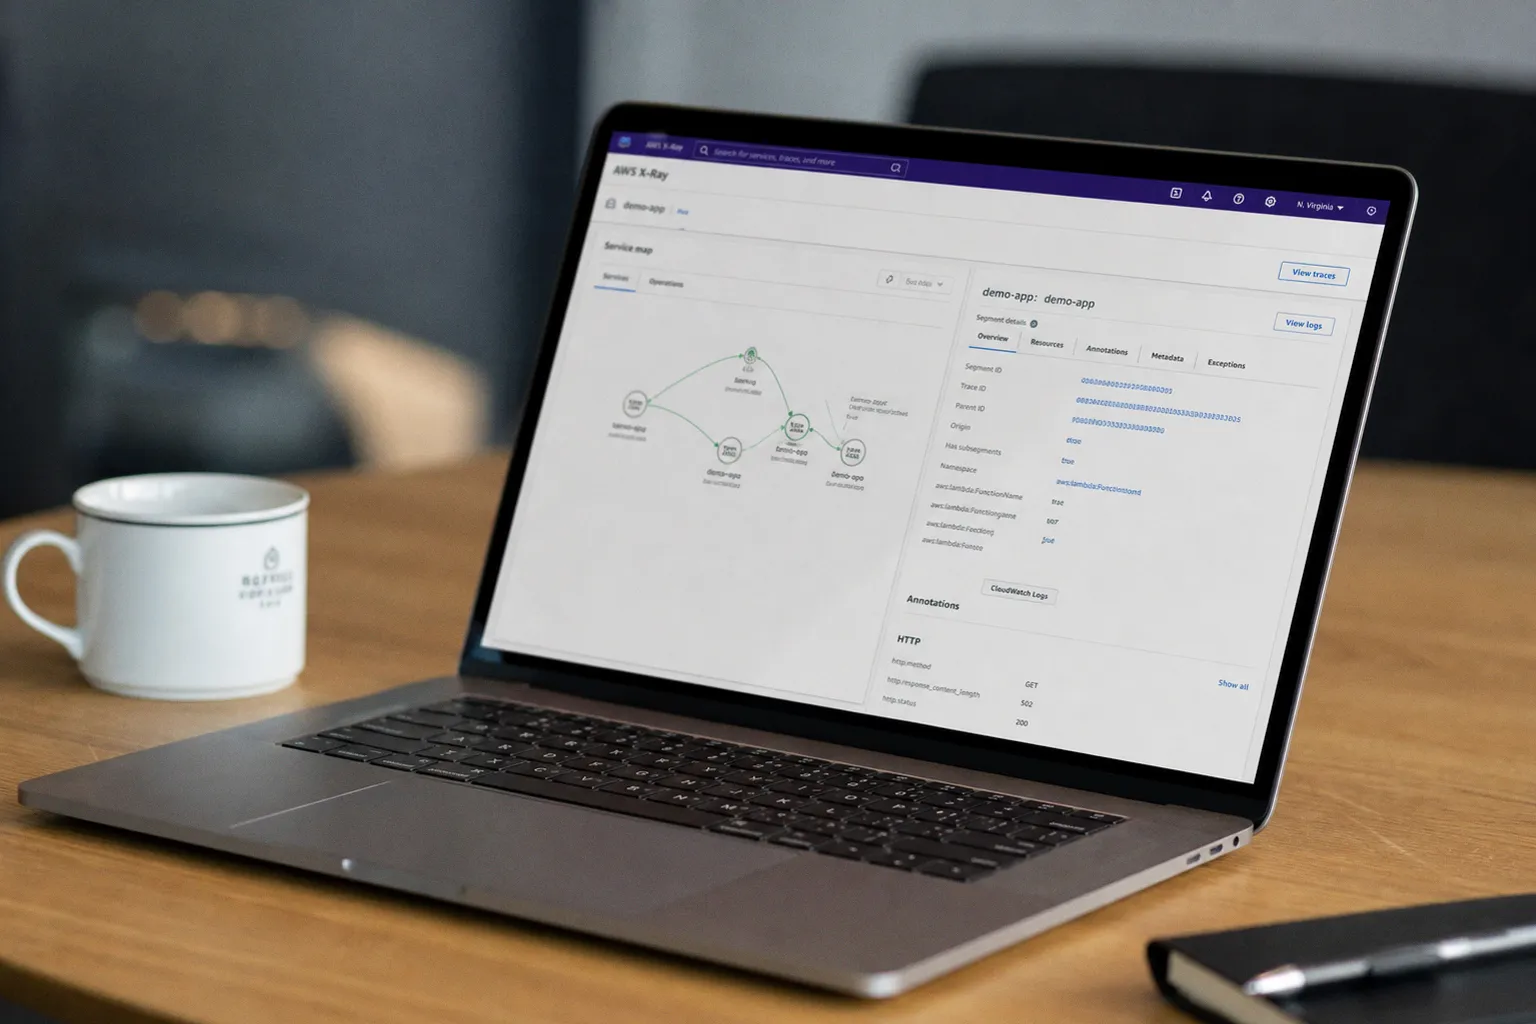
AWS X-Ray produces the trace map you need: the gateway hop, the function initialization segment, the handler duration, and the downstream calls. The service map will tell you whether time is being absorbed by init or by downstream APIs. Datadog's Serverless Monitoring extends this with cold start tagging out of the box and lets you slice P50, P95, and P99 cold start latency per function, per route, per memory tier. Lumigo specializes in this exact problem and produces the cleanest cold start waterfall I have used — it isolates init time from handler time and surfaces memory pressure the moment it appears.
For teams that want sanity checks without vendor lock-in, a synthetic monitoring job that hits a known cold endpoint every five minutes after a manual warm-pool purge gives you a clean number per cycle. Combine that with custom logging wrappers — wrap your handler in a try/catch that logs the duration between the API Gateway invocation timestamp and the first line of handler execution, then subtract handler duration to isolate init. The teams who skip this and rely on average latency will find that their P99 hides a 2-second tail they never see in dashboards.
A practical recipe for a lightweight cold start audit:
1. Identify your five most latency-sensitive API routes.
2. For each, write a synthetic test that invokes the function after a forced idle period of at least ten minutes.
3. Log three timestamps: API Gateway receive time, function init-complete time (the first log line inside your handler), and function response time.
4. Subtract init-complete from receive — that is your cold start. Subtract response from init-complete — that is your handler time.
5. Run this for a week across different memory tiers and different times of day. Cloud providers throttle initialization differently under load, and you will see variance that a single benchmark cannot capture.
6. Plot the results per function per memory tier. Share the chart with whoever owns the architecture decision. Numbers end arguments.
If your observability cannot isolate init from handler, you are measuring the wrong metric. The dashboard is lying to you in useful ways.
Architectural Mitigations: Moving Beyond Function Warming
Now, the painful part. The most popular fix for cold starts in the field is function warming — scheduled pings every few minutes to keep containers alive. I have seen this sold as a best practice by well-meaning engineers and by some consulting partners. In 2026 it is an anti-pattern. You are paying for compute you don't consume; you are creating an architecture that depends on a cron job nobody owns; and you are masking the latency you should actually be measuring.
There are three specific ways warming fails. First, provider-side recycling: AWS can and does recycle Lambda execution environments at unpredictable intervals for patching, scaling, or resource reclamation. Your five-minute ping does not guarantee a warm container. Second, concurrency scaling: warming keeps one container warm per function; under a burst of fifty concurrent requests, forty-nine of them still cold-start. The mechanism solves a toy scenario and breaks under real load. Third, cost and ownership: nobody on the team owns the warming schedule, nobody audits whether the cron job is still running after a deployment, and nobody accounts for the cost of idle compute in their function budget. It is technical debt disguised as optimization.
The legitimate answer is AWS Provisioned Concurrency, introduced in 2019 specifically to address this problem. You declare the number of warm execution environments you want kept initialized; the provider keeps them ready; cold start effectively vanishes within the configured floor. The cost is the cost of those warm containers — which, let me translate, is the same as running that function on a baseline of always-on compute. If your traffic justifies it, the trade is clean. If it doesn't, you are subsidizing a problem that didn't exist.
For teams outside AWS, the equivalent options are Azure Functions Premium Plan with pre-warmed workers and GCP Cloud Run with `min-instances` set above zero. Both work. All of them share the same honest economics: you are paying for always-on capacity. That is a fine price for predictable latency. Pretending pinging does the same thing for free is the kind of mirage that ends up in a post-mortem.
The architectural pattern I prefer, when traffic permits: keep the synchronous API path on provisioned concurrency, and push everything that can tolerate 200–500ms of latency into asynchronous queues or step functions. Use cold-start-tolerant workloads for low-priority batch, image processing, webhook fan-out. Reserve the warm path for the revenue-generating request that has to answer in under 200ms. You don't fight cold starts everywhere; you route around them where they cost you money and accept them where they don't.
Another mitigation that deserves more attention than it gets: reduce the artifact. Every megabyte you shave off your deployment package is a direct reduction in cold start time. Tree-shake your dependencies, strip unused layers, audit your `node_modules` or fat jar for transitive packages you never import. I have seen a Node.js API cold start drop from 300ms to 140ms by removing three unused SDKs that the original developer included "just in case." Artifact diet is unglamorous work. It is also the mitigation that compounds with every other strategy on the table.
The Honest Take
Serverless cold starts are not a pathology to be eliminated; they are a bill to be measured. The teams I trust do three things consistently: they pick runtimes that respect the cold start budget, they tune memory to convert dollars into milliseconds, and they instrument the init path separately from the handler path. Everything else is marketing.
If your stack still defaults to Java because of organizational inertia, the latency tax is real and quantifiable, and it is showing up in your conversion funnel whether your dashboards have caught it or not. The fix is not a clever hack or a cron job. The fix is one architectural decision, made by someone with the authority to make it.
For teams who want to stress-test vendor claims about "negligible" cold starts before committing to a runtime, run your own benchmarks — isolate the init path, vary the memory tier, and compare across at least two runtimes with equivalent business logic. Dissect the methodology instead of taking marketing numbers on faith. That discipline will serve you better than any vendor whitepaper ever will.